Pfizer/BioNTech C4591001 Trial - How many mathematical proofs of fraud in this trial do we need, for independent inquiries to finally start ...?
Returning to exclusions & PCRs, highlighting some problematic sites and new statistical Loch Ness Monsters.

Introduction
This article is the product of a joined effort with Josh Guetzkow1. Both authors contributed equally to this paper.
We covered in a previous article2 how to identify accurately in the PHMPT documents3 the 372 exclusions labelled “other important protocol deviations”, and why what could seem like a small detail mattered a lot as far as providing demonstrable evidence that this trial was fraudulent.
We first present here an analysis of said exclusions4 by trial sites, comparing it to the number of subjects screened at each site, and illustrating the fact that said exclusions are over-represented at a very limited number of sites (8 on a total of 152).
In a second section, we develop how to identify local PCRs. We already covered in another Substack5 how to identify Pfizer’s Pearl River6 “Central laboratory” PCRs, to which we will come back later in this post, taking a new angle on the data.
We bring forward a new evidence of fraud regarding these PCRs, based on the imbalance between the proportion of BNT162b2 (the “vaccine” tested) symptomatic subjects who had local tests registered, compared to the proportion of Placebo subjects.
This leaves us with only three hypotheses (“test suppression”, “implicit unblinding” or “discouragement to get tested” of the subjects). None will be pleasant to consider for whoever would still like to believe in the trial’s integrity, given they assume some form of “hidden unblinding” of the subjects, in complete violation of the protocol.
Phase 3 Subjects Screened By Sites
We established the following mapping of the 44 155 phase 3 subjects, 16 or older, who were screened, by sites, at data cut-off date (November 14, 2020).
Shall you be surprised that this number doesn’t fit the NEJM’s one (44 820)... ours has the advantage to be backed with code & data8, and the NEJM study screening figure includes 609 subjects screened post November 14, and 195 phase 1 subjects - among other errors, to reach this overinflated total9.
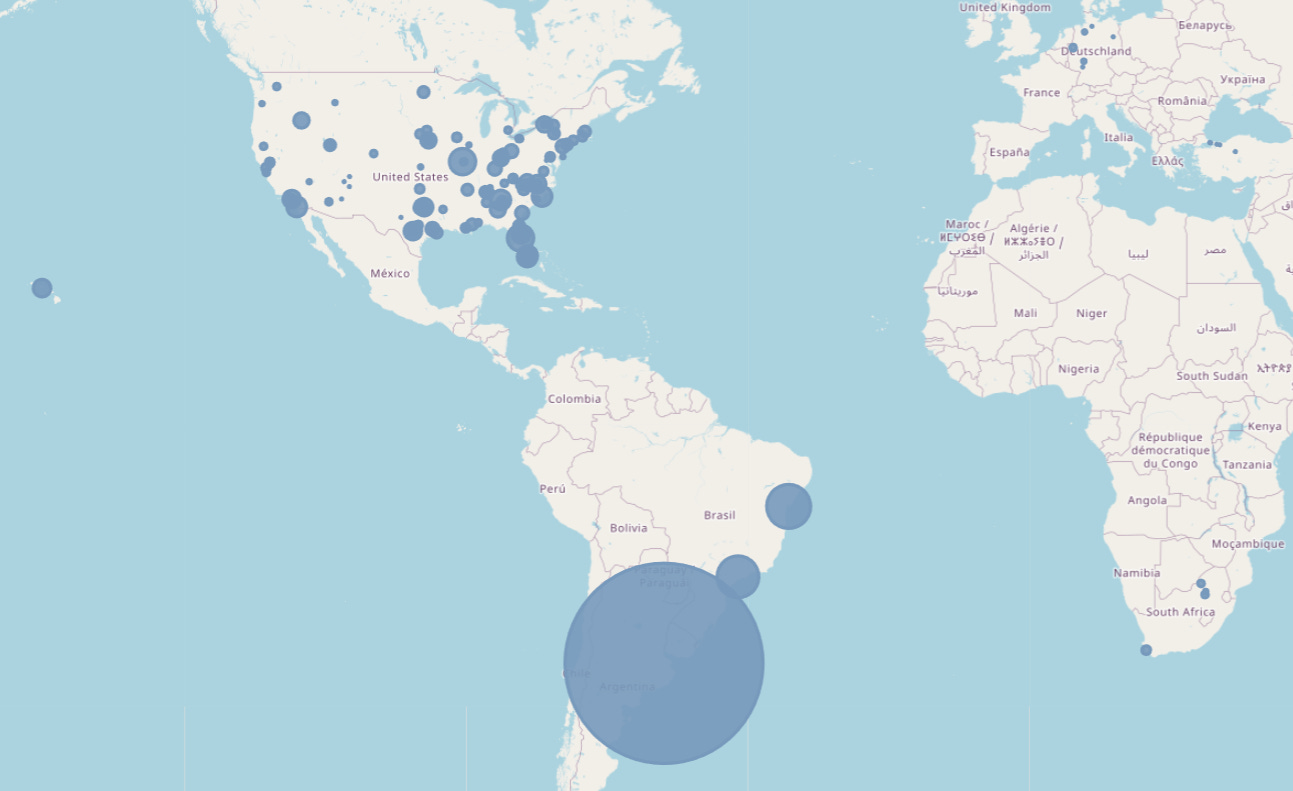
The map highlights, if needs be, the importance of the site 1231 (and “site 4444”, “virtual site” which was in fact the same 1231).
At cut-off date of Nov. 14, 2020, Argentina had, according to the documents, screened 5 776 subjects. Argentina accounts for 13.08% of the total subjects screened during the trials (with its sole site, whose principal investigator was the lead author of the NEJM study10, Fernando Polack).
Excluding Argentina’s site 1231, the average total subjects screened by each site is 289 (min: 12 subjects; max: 1549 subjects).
Exclusions Due to “Other Important Protocol Deviations” by Sites
The number of exclusions for other important protocol deviations by site is synthesized in the following Google Spreadsheet11.
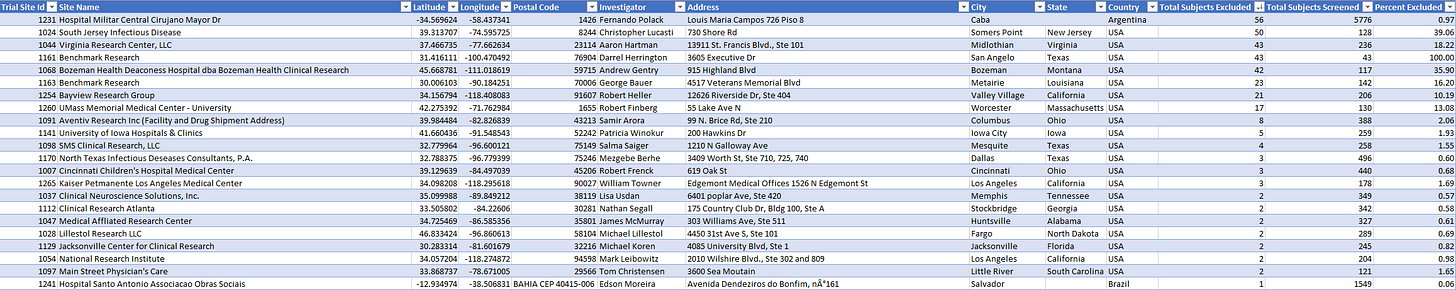
As illustrated by the above table, only 10 sites accounted for more than 5 exclusions.
Some 7 sites are blinking red, with more than 10% of their subjects excluded:
- Site 1260, UMass Memorial Medical Center - University (Worcester, Massachusetts), Principal Investigator Robert Finberg, 17 exclusions, 13.08% of its 130 subjects.
- Site 1254, Bayview Research Group (Valley Village, California), Principal Investigator Robert Heller, 21 exclusions, 10.19% of its 206 subjects.
- Site 1163, Benchmark Research (Metairie, Louisiana), Principal Investigator George Bauer, 23 exclusions, 16.2% of its 142 subjects.
- Site 1068, Bozeman Health Deaconess Hospital (Bozeman, Montana), Principal Investigator Andrew Gentry, 42 exclusions, 35.9% of its 117 subjects.
- Site 1161, Benchmark Research (San Angelo, Texas), Principal Investigator Darrel Herrington, stands out with an exceptional 43 exclusions, 100% of its 43 subjects screened.
- Site 1044, Virginia Research Center, LLC (Midlothian, Virginia), Principal Investigator Aaron Hartman, 43 exclusions, 18.22% of its 236 subjects.
- Site 1024, South Jersey Infectious Disease (Somers Point, New Jersey), Principal Investigator Christopher Lucasti, 50 exclusions, 39.06% of its 128 subjects.
95 sites don’t have a single exclusion.
- Argentina and its site 1231/4444, the “Hospital Militar Central” has a less shocking rate of 0.97% of exclusions (56 on 5776) but still qualifies as the highest total of excluded subjects.
We can make it clearer by looking at another map focused on US & South America (European, Turkish & South African sites have no interest here), with a scale of 2500 meters per exclusion & 250 meters for each subject screened (making the orange circle - the exclusions - bigger than the grey circle - the screened subjects - when the site has excluded 10% or more of its screened subjects).
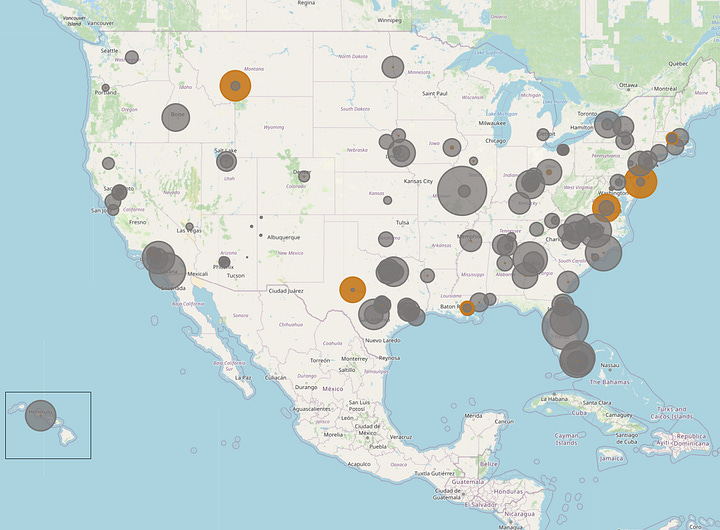
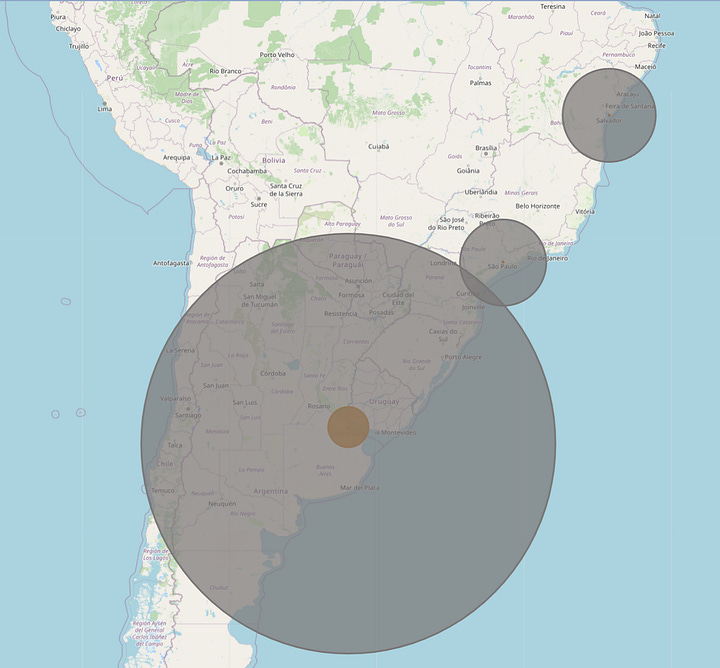
These 8 sites account for 295 of the 372 "other important protocol deviations" exclusions (79.3%) with 6 778 subjects (15.35% of 44 155).
We can calculate the likelihood - which you can verify yourself on this website12 for example - for this to have happened by chance in a normal randomized trial using a chi-square test. The p-value is less than 1e-50 if we use more precise statistical tools.
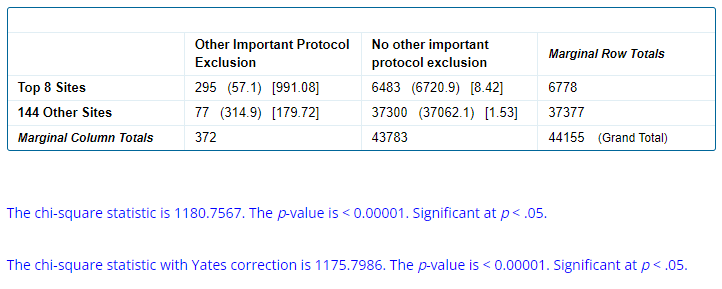
Jikkyleaks13 & Mathew Crawford14 already highlighted that this major anomaly was affecting mostly BNT162B2 recipients, with a similar impossibility of this happening by chance, around 3.8e-39...
Regulatory agencies caring to do their job would have normally investigated in depth when such things are observed at a < 0.00001 probability.
So, we have an impossible phenomenon, striking a specific treatment arm of the trial (the tested product’s one), in impossible proportions. This means that subjects are excluded from the efficacy analysis though still in theory included in the safety analyses. No big deal, that couldn’t have been used to hide major manufacturing process issues (these having the potential to produce even more severe adverse effects15), for example. If this theory is correct and that "bad batches" have been pushed under the rug during the trial, due to storage, preparation and administration of the produce under these "carefully" controlled trial conditions, we let our reader imagine how much worse it would be when it was rolled out to millions of people across tens or hundreds of thousands of vaccination sites.
So far we have never seen these problems addressed by the pharma-propagandists official experts.
Please link in the comment if you’ve seen such position explaining these miracles, so we can debate their authors, but it’s unlikely someone would risk ridicule to the point of negating that clear mathematics - no matter how low they are used to going.
In the meantime, we can only observe the deafening silence of the main-stream media on the emblematic cases of Brook Jackson16, the Augusto Roux17 or Maddie de Garay18 scandals, among other giant red-flags surrounding this trial.
Let's therefore consider it won’t be enough to awaken most "journalists" to the fact that there is an in depth problem with this trial - and add another miracle to the list by looking at local PCRs after a quick detour back to the central ones & symptomatic subjects...
PCR Testing of Symptomatic Subjects
At the EUA cut-off date of November 14, 2020, potential COVID-19 symptoms were reported by 4 178 subjects (1834 BNT162b2, 2344 Placebo), across 4 442 “Covid associated visits” (1 959 BNT162b2 & 2 483 Placebo) according to the XPT file “S1_M5_c4591001 A D adsympt”19, refined with another XPT file, “S1_M5_c4591001-01-S-Supp-D-face”, which contains the earliest dates on which subjects reported symptom onsets. (There are more visits than subjects because subjects could have multiple visits if they reported suspected covid symptoms more than once). For further details about symptomatic conditions or central PCR identification, please refer to our last paper20.
What we need to remember here is this 4 442 “Covid associated visits” (1 959 BNT162b2 & 2 483 Placebo) - given that we want to compare the likelihood for subjects to be tested depending on which treatment arm they’re in.
Central PCRs by Treatment Arms
There is several ways to look at the Symptoms & Central PCR data.
- The “per protocol” one we adopted in our last article implies that swabs should have been collected, either by the subject himself using self-testing swabs, or by the local site, no more than 4 days before or after the onset of the symptoms. These settings (adjusted to +/- 5 days) are the ones that bring us the closest to the subjects documented in the .PDF file of COVID-19 cases in Pfizer’s submission to the FDA.
- Another way is by looking at COVID visits. When a subject declared symptoms associated with Covid, these were related to a “COVID_*” visit. The first suspected Covid for a given subject was labelled “COVID_A”, the second “COVID_B”, etc. The swabs were collected in an anarchic time window (up to 207 days to the symptoms onset date - although most were collected within 7 days) and associated with the visit in relation to which they had been collected.
Both methods produce slightly different but very similar results as far as the new miracle we want to highlight is concerned. Given results are similar, we shall here be indulgent and focus on the “Pfizer” one - and their own “visit based” analysis method.
Swabs were collected and tested at Pearl River’s “Central laboratory” on 3 571 occurrences (1558 BNT162b2, 2013 Placebo).
Otherwise said, swabs were collected and tested centrally 80.39% times when symptoms were reported in association with a “Covid visit” (79.53% for BNT, 81.07% for Placebo).
Identifying Local PCRs
Identifying the local tests was a far from obvious exercise, which was, luckily, overcome by Josh Guetzkow:
- “S1_M5_c4591001-S-D-mb” (“MB File”) - a SAS .XPT file (proprietary format of the statistical software used during the trial), contains the results of the PCRs tests performed.
- Local PCRs required another file, “S1_M5_c4591001-S-D-di” ("DI File"), to be identified with certainty.
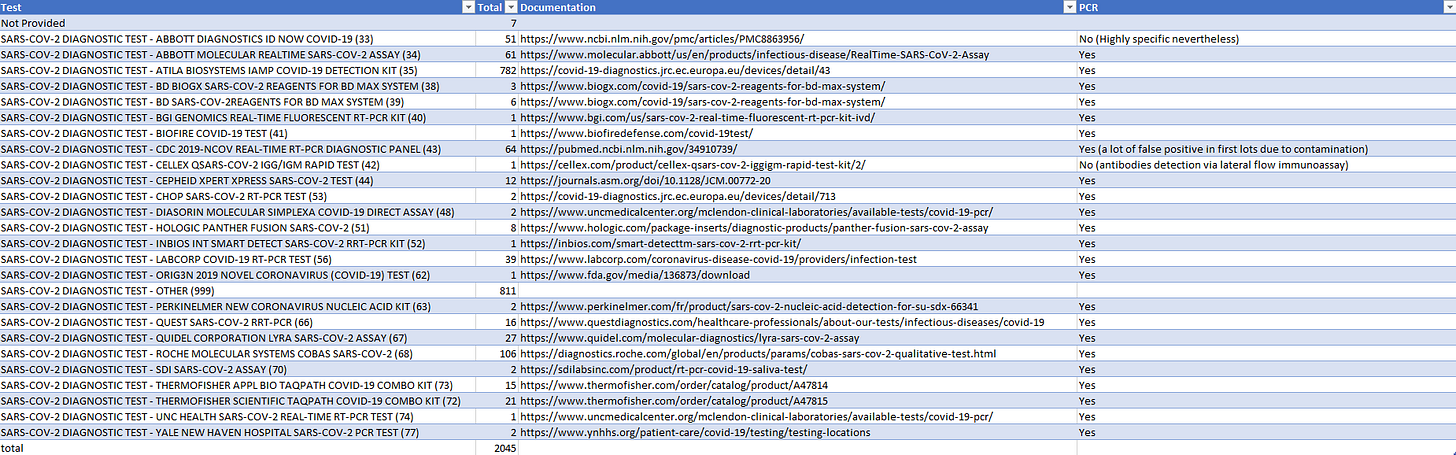
For researchers interested in independently reproduce our results, this “DI File” file contains, like the “MB File”, an ‘SPDEVID’ column which allows translation of the numerical code, indicated in some ‘SPDEVID’ entries (the rows which have the ‘MBTEST’ value set to “SEVERE ACUTE RESP SYNDROME CORONAVIRUS 2”) in the MB file. This allows us to assert with confidence that these tests, further documented thank to Geoff Pain21 in the following Google Spreadsheet22, are for a vast majority the local PCRs recorded. In some rare other cases other detection means than PCRs was used as detailed in the table below.
The 1 891 local PCRs results recorded in association with a "covid symptomatic" visit, to cut-off date of November 14 2020, can be downloaded by "subject id" in the following Google Spreadsheet23.
The real issue we wished to highlight here is pointing out when we look at the breakdown by treatment arms, which is 768 BNT162b2 & 1 123 Placebo. The findings so far are summarized in the table below.
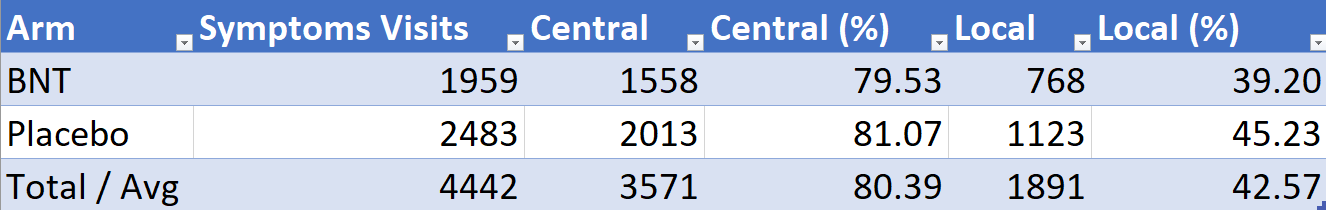
In other words, Placebo subjects were more likely (45.23%) to be locally tested (or to have their local test properly recorded) than the BNT162b2 recipients (39.20%).
We can once more compute a chi-square test p-value to evaluate the probability of such discrepancy to have happened by chance, comparing the locally tested & non tested symptomatic population of each group.
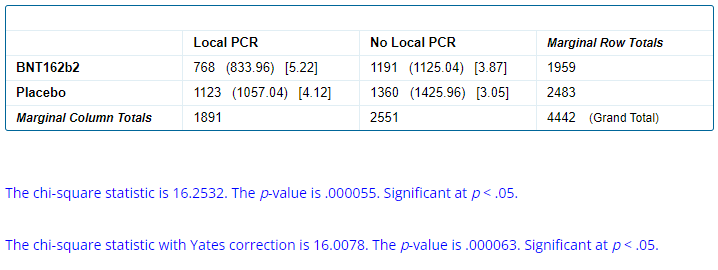
Once again, the probability of this spread occurring by chance is extremely low.
This leaves us with 3 hypotheses:
- Local tests were done less frequently based on the treatment arm of the subjects, or haven’t been recorded, or have been erased.
- Subjects may have been discouraged by the trial sites to get tested depending on their arm.
- Subjects who received the BNT162b2 were more likely to believe they were “vaccinated”, either because of poor blinding or heavy reactogenicity. As a result, they did not go to get a local test to check if they had an infection, because they assumed they were vaccinated and so did not have COVID.
Of course, these hypotheses aren’t mutually exclusive. All we can guarantee given the data is that a lot of things went very wrong during this trial, involving some form of hidden unblinding of the subjects.
Assuming that Pfizer knew how to detect which subject received which product (something which was technically doable as demonstrated by Jikkyleaks), and in a context where the testing sites were controlled by… Pfizer Employees… implementing fraud was child-play.
… But they wouldn’t cheat, right?

💬 Join the conversation
Want to like, comment, or share this article?
Head over to our Substack page to engage with the community.
Likes, comments, and shares are synchronized here every 5 minutes.