Pfizer/BioNTech C4591001 Trial - Local & Central Testing Rates on Symptomatic Visits, by Trial Sites
Another good old corruption pattern - with the major anomaly on "local testing rates between arms" concentrated on completely abnormal US sites.
This article is the product of a joined effort with Josh Guetzkow1. Both authors contributed equally to this paper.
Introduction
This short article follows up on our analysis of the Local vs Central PCRs performed2 on symptomatic visits.
In this previous post, we demonstrated a significant offset in local testing rates vs central ones overall through the EUA data cut-off of Nov. 14, 2020.
Here we focus on determining if the anomalies in testing rates were widespread or were limited primarily to a few trial sites. We also examine whether there were any differences in this anomaly before and after the EUA data cut-off.
We took the Biologics License Application (BLA3) data cut-off date of March 13, 2021 (or at unblinding date of the subject - whichever the earliest) to maximize the data at the site level and allow us to compare the sites performances before & after EUA.
Symptomatic Visits by Sites
65 sites registered at least 50 symptomatic visits, 82 at least 40 visits, and 103 sites reported at least 30. (A visit here is when a subject reports an official COVID-related symptom to their testing site, at which point they should have been instructed to either come in for a PCR test to be sent to the central lab or to do a swab at home with an at-home kit. The central test results were eventually reported to the trial site, but anyone wishing to know whether they had COVID at that moment would have needed to have a test done locally.)
We limited our current analysis to 50 visits at least, in order to be able to compute a p-value for each site on the local vs central testing rates, allowing us to highlight the most significant anomalies4.
Site 1231 has central tests for on 94.28% of its 682 symptomatic visits on the BNT162b2 group, and 95.67% of its 832 Placebo visits. Site 1231 also performed local tests on 95.45% of its BNT162b2 visits, and 94.23% of its Placebo visits.
It establishes that even in the “most complex site to manage,” local tests were done (or registered) at the same rate as central tests, as pointed out by The Mouse (that’s not to say that site 1231 was exemplary - far from it - as we will deepen in a soon to come article).
The most abnormal sites, as far as their local testing rate of BNT162b2 vs Placebo is concerned, are listed below:
- Site 1005, Rochester Clinical Research, Inc., led by Matthew Davis
24.3% of its 37 BNT162b2 visits being locally tested
51.2% of its 41 Placebo visits being locally tested
chi-square: 5.94, p-value 0.01
- Site 1006, J. Lewis Research Inc., led by James Peterson
6.8% of its 44 BNT162b2 visits being locally tested
31.9% of its 47 Placebo visits being locally tested
chi-square: 9.02, p-value 0.002
- Site 1007, Cincinnati Children's Hospital Medical Center, led by Robert Frenck
36.4% of its 22 BNT162b2 visits being locally tested
62.5% of its 48 Placebo visits being locally tested
chi-square: 4.15, p-value 0.04
- Site 1028, Lillestol Research LLC, led by Michael Lillestol
40.7% of its 27 BNT162b2 visits being locally tested
76.1% of its 46 Placebo visits being locally tested
chi-square: 9.12, p-value 0.0025
- Site 1042, Benchmark Research, led by William Seger
13.0% of its 23 BNT162b2 visits being locally tested
37.9% of its 29 Placebo visits being locally tested
chi-square: 4.04, p-value 0.04
- Site 1056, Indago Research & Health Center, Inc., led by Jose Cardona
0% of its 31 BNT162b2 visits being locally tested
14.29% of its 21 Placebo visits being locally tested
chi-square: 4.69, p-value 0.03
- Site 1057, Clinical Neurscience Solutions, Inc., led by Fadi Chalhoub
7.89% of its 38 BNT162b2 visits being locally tested
36.11% of its 36 Placebo visits being locally tested
chi-square: 8.68, p-value 0.003
- Site 1090, M3 Wake Research, Inc, led by Lisa Cohen
22.73% of its 44 BNT162b2 visits being locally tested
46.67% of its 60 Placebo visits being locally tested
chi-square: 6.27, p-value 0.01
- Site 1116, MedPharmics, LLC, led by Paul Matherne
21.43% of its 14 BNT162b2 visits being locally tested
56.41% of its 39 Placebo visits being locally tested
chi-square: 5.058, p-value 0.02
- Site 1123, Meridian Clinical Research, LLC, led by Brandon Essink
10.53% of its 38 BNT162b2 visits being locally tested
45.59% of its 68 Placebo visits being locally tested
chi-square: 13.55, p-value 0.0002
- Site 1135, Anaheim Clinical Trials, LLC, led by Peter Winkle
14.06% of its 64 BNT162b2 visits being locally tested
28.26% of its 92 Placebo visits being locally tested
chi-square: 4.37, p-value 0.0002
- Site 1149, Collaborative Neuroscience Research, LLC, led by Steven Reynolds
7.14% of its 28 BNT162b2 visits being locally tested
27.03% of its 37 Placebo visits being locally tested
chi-square: 4.18, p-value 0.04
- Site 1162, Atlanta Center for Medical Research, led by Robert Riesenberg
3.57% of its 28 BNT162b2 visits being locally tested
28.57% of its 49 Placebo visits being locally tested
chi-square: 7.099, p-value 0.007
- Site 1226, CEPIC - Centro Paulista de Investigacao Clinica e Servicos Medicos Ltda (Casa Blanca), led by Cristiano Zerbini
15.38% of its 169 BNT162b2 visits being locally tested
24.9% of its 245 Placebo visits being locally tested
chi-square: 5.45, p-value 0.019
- Site 1247, Tiervlei Trial Centre, Basement Level, Karl Bremer Hospital, led by Haylene Nell
20.83% of its 24 BNT162b2 visits being locally tested
48.15% of its 27 Placebo visits being locally tested
chi-square: 4.15, p-value 0.019
- Site 1269, Providence Clinical Research, led by Teresa Sligh
9.68% of its 31 BNT162b2 visits being locally tested
42.86% of its 21 Placebo visits being locally tested
chi-square: 7.76, p-value 0.005
We can therefore conclude that the “local test suppression” was a phenomenon concentrated on a few US sites. As we establish in a joined analysis of the efficacy population, it’s highly likely that local tests weren't performed - or recorded - when BNT162b2 subjects were suspected to have COVID-19, given the most significant over-representation of this population in the anomalies we noted5.
Rates Before vs. After EUA
Results are available in the following spreadsheet6. Some offsets with the figures presented in our last paper are explained by the fact that we are using the sole symptoms onset date as basis to distinguish between the time periods, as mentioned above.
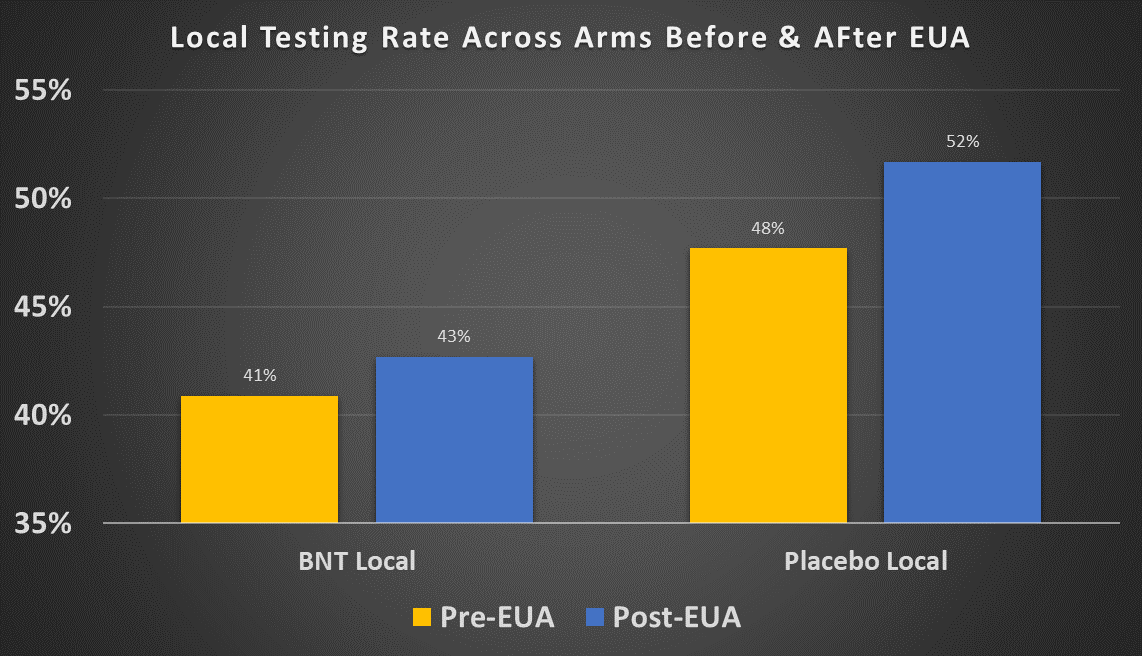
The local testing rate for both treatment and placebo increased after the EUA cutoff: from 40.9% to 42.7% for the treatment group and from 47.7% to 51.7% for the placebo group. Both of these increases are statistically significant. One possible explanation is that local tests were less readily available in the period July 27-Nov. 14 but more available after Nov. 14, 2020. However we saw that local tests in Argentina were made available to the subjects at rates , and the vast majority of the remaining participants were in the US, where tests were quite widely available by late summer 2020. So this explanation does not seem very plausible.
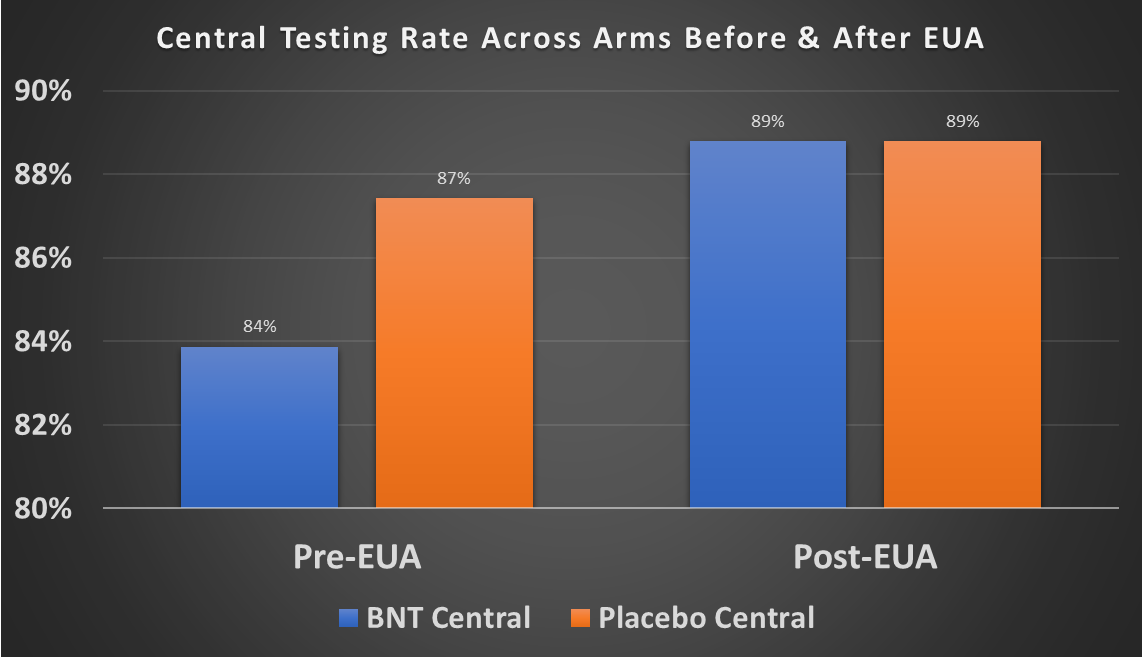
Over the entire period, the central testing rate between treatment and placebo is the same. But when you compare before vs. after the EUA data cut-off on Nov. 14, the central testing rate for the treatment group is lower (83.9%) than for the placebo group (87.5%). You don't see a difference in the post-EUA period (88.8% vs 88.8%). The pre-EUA difference is highly statistically significant. So in other words, prior to the EUA cut-off treatment subjects were less likely to have a central test done than placebo subjects. Unlike with local testing, there is no apparent innocent explanation for why the central testing rates increase after the EUA cut-off.
Thanks for reading OpenVAET’s Substack! Subscribe for free to receive new posts and support our work.
As usual, the code used to generate this analysis can be accessed on GitHub.
💬 Join the conversation
Want to like, comment, or share this article?
Head over to our Substack page to engage with the community.
Likes, comments, and shares are synchronized here every 5 minutes.
One unusual observation is that the BNT162b2 group had 801 central PCR tests done in the pre-EUA period and 800 in the post-EUA period. That is very balanced, almost suspciously so, and very different from the imbalance in tests in the placebo group across the two periods (2171 vs. 2415).