The "New-Zealand whistle-blower" story is a dead-end for valid arguments
Too many people are falling for the New Zealand Data trap. There are no alert signal in the New Zealand mortality trends and the data released is unusable.
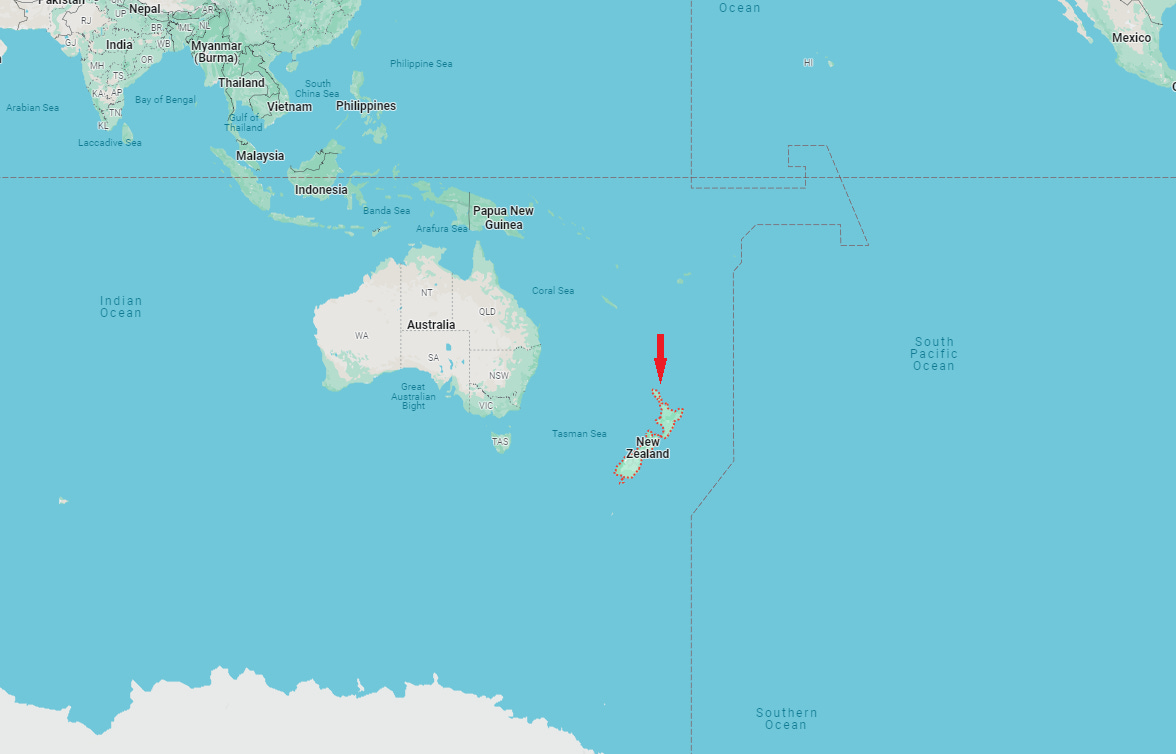
New Zealand is an island nation of the Tasman Sea, populated by 5.2 millions people.
It became a center of attention when, on November 29, 2023, the Twitter account “NZLoyal” released a video featuring Elizabeth Jane Cooney, commonly known as “Liz Gunn”, and of someone introducing himself as an anonymous whistle-blower, “Winston Smith”1. A few minutes after the video2 publication, Winston Smith turned out to be one Barry Young, as his name was thrown on Twitter, and his identity has been made very public since3.
The video was swiftly relayed by Steve Kirsch, who had been teasing it for a few weeks.
As we highlight here, the arguments advanced by Barry Young are in a vast majority bad - or at least poorly presented.
If one had wanted to pick the worst country possible to illustrate the jab damages, he would have probably picked New Zealand. It’s a very small population, where demographic problems wouldn’t go unnoticed, and so far the exceptional data we see on islands4 tenses to indicate that Pfizer privileged large countries to ship its doubtful batches. New Zealand is no exception to this pattern, and displays no visible safety signal.
In addition, alterations made to the data by Kirsch are forbidding serious re-analysis, against the explicit purpose stated by Barry Young.
Summary of the M.O.A.R (“Mother of all revelations” 🙄)
- 00:00 → 07:45 - A few minutes of introduction.
- 07:46 → 08:45 - Barry Young, database administrator, involved with Global Projects, helped to implement a vaccine payment system for the providers, with a “pay per dose” system, which he helped building. He noticed discrepancies, people dying within a week after getting vaccinated.
- 08:46 → 16:00 - Discussion
- 16:01 → 17:00 - “This” isn’t COVID.
- 17:01 → 29:11 - “120 crude deaths through history” “analysis”.
- 29:12 → 32:00 - 30% of subjects injected would have died in one Hospital, which is higher than New Zealand’s average mortality. A few other sites are showed.
- 32:00 → 37:10 - Discussion
- 37:11 → 41:20 - The dataset isn’t complete (2.2 millions people) but accurate. Barry clearly wants the original dataset released, to provide undeniable arguments.
- 41:21 → 45:40 : More hospitals to global mortality rate comparison.
- 45:41 → 50:10 : Entirely unusable batch analysis, with obfuscated batch reference, unclear source on doses administered, and out-of nowhere rates which don’t correlate to the figures on screen or the data provided by Kirsch.
- 50:11 → 54:02 : It’s across the general population, not just in old ages. More useless batch analysis.
- 54:03 → 57:32 : Now Liz does the analysis and Barry says “yes” to whatever nonsense she is articulating.
- 57:33 → End : Discussion
Later in the day, Steve gave his “MIT lecture”5. I won’t summarize this one as there is only so much one can inflict himself in a single day. As usual with Steve, the only elements of interest are borrowed to others.
There is only one detail you needed to pay attention to:
- 48:50 → 49:55 - The data made public has been “obfuscated”. In layman terms, this means it has become impossible to verify, and useless for any form of real analysis6. As Steve proudly says “no record matches anything about any of the people in it”. Forget his reserves about “statistics not being altered” ; he just means “his own crappy analysis” and doesn’t understand what he has done.
Sources
Deaths & Populations are exported from infoshare.stats.govt.nz.
- Population → Deaths - VSD → Deaths by age and sex (Annual-Dec)
Filters: All sexes, all Times, Ages by 1 year from Less than one year to 100 years and over. - Population → Population Estimates - DPE → Estimated Resident Population by Age and Sex (1991+) (Annual-Dec)
Filters: Estimate Type "As at", all Population Groups (sexes), all Times, Observations (age) at 0 years => 94 years, and 95 years and Over.
Raw files are converted to a more usable .CSV7, normalizing the data & incrementing yearly totals by 10 years age groups.
Mortality by age groups in New Zealand
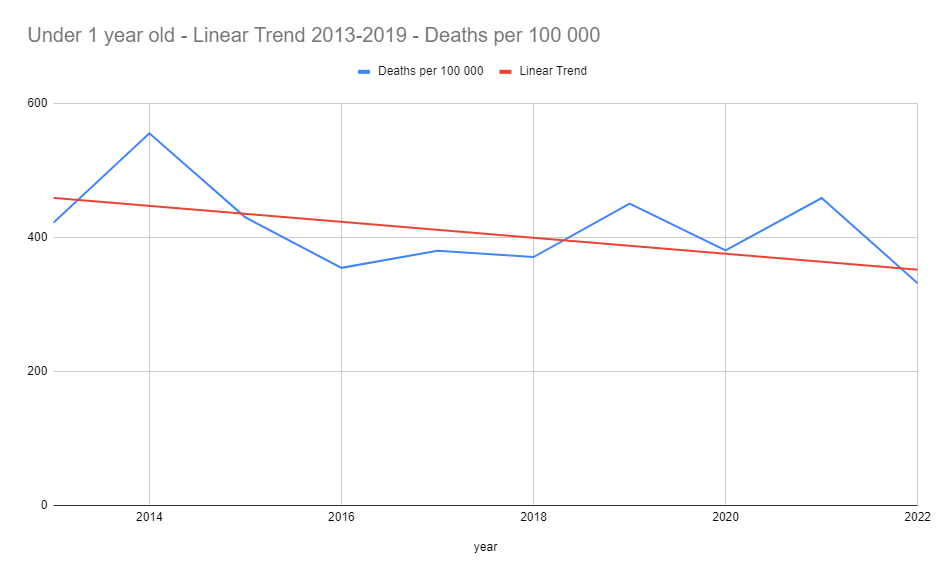
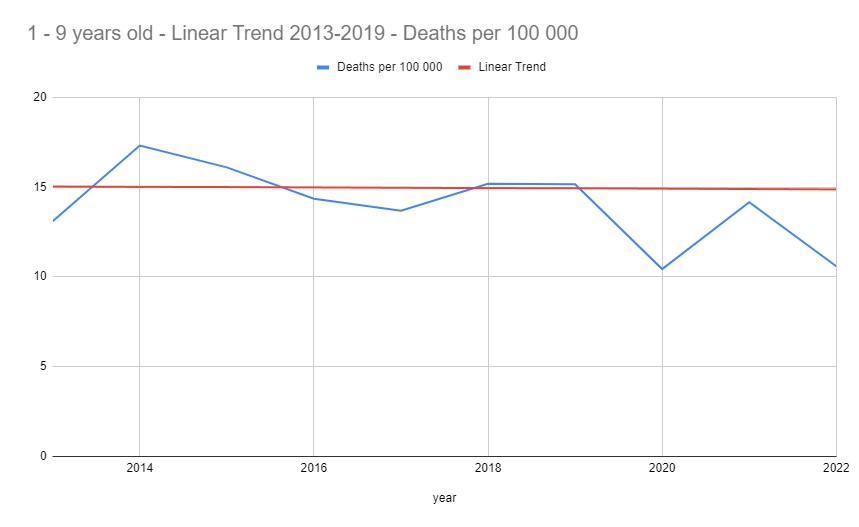
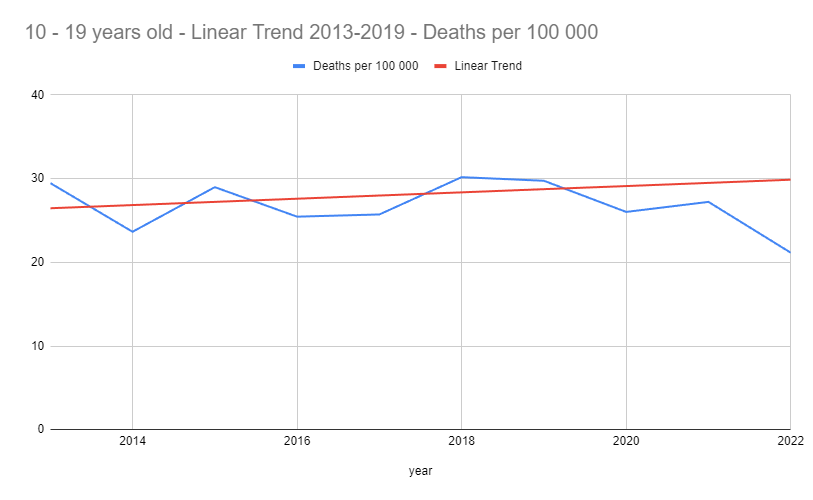
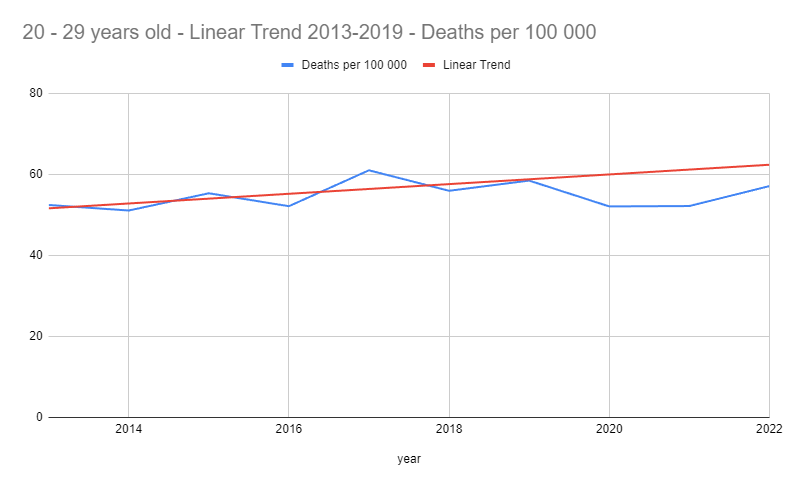
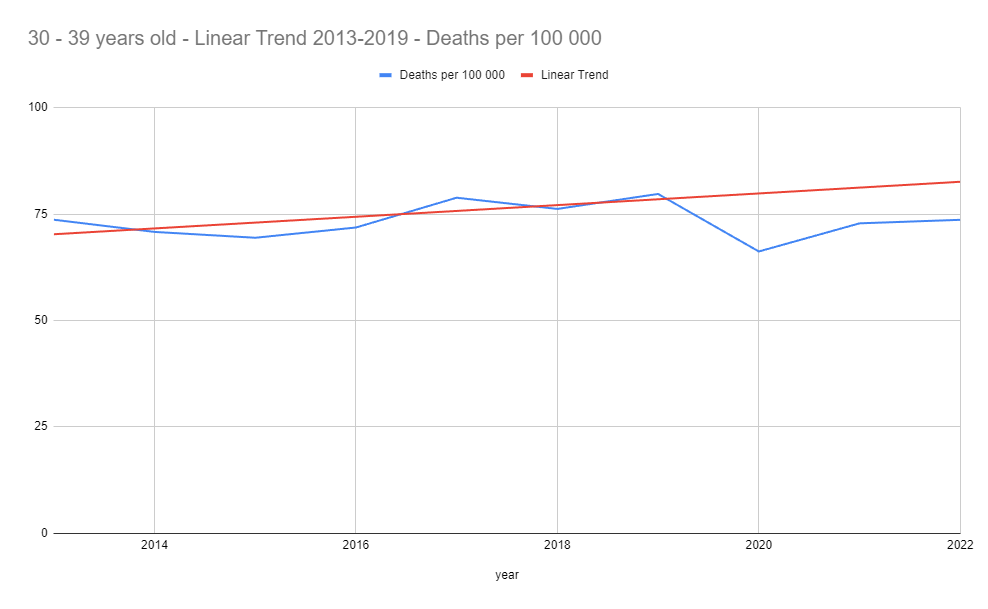
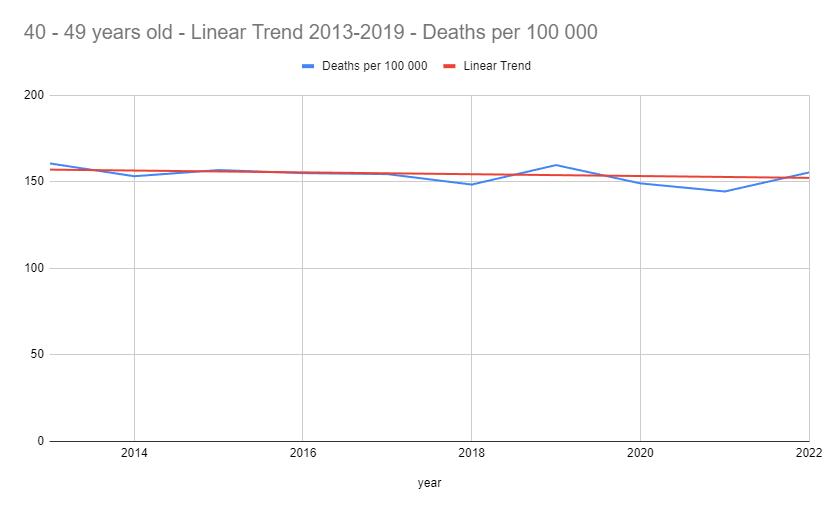
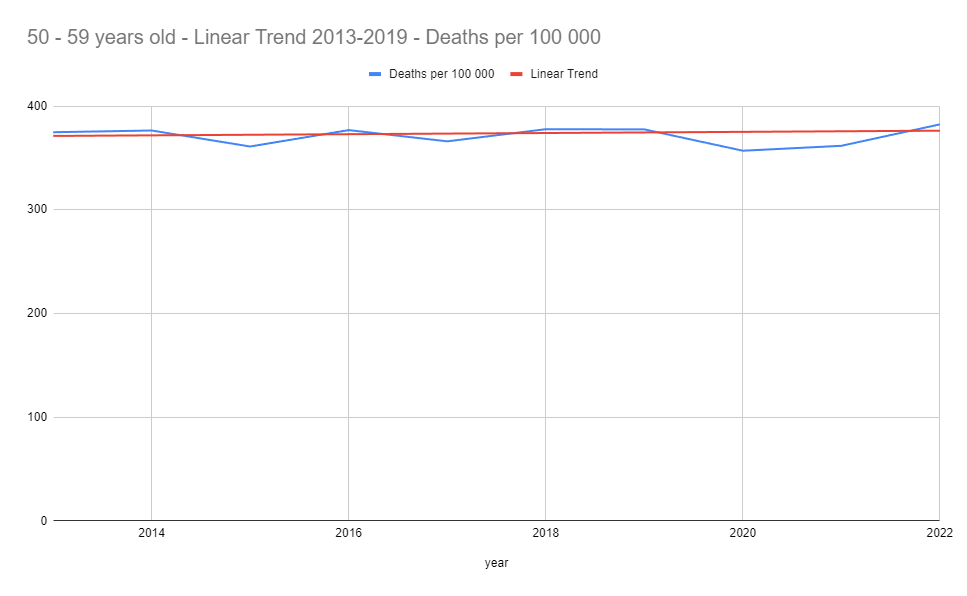
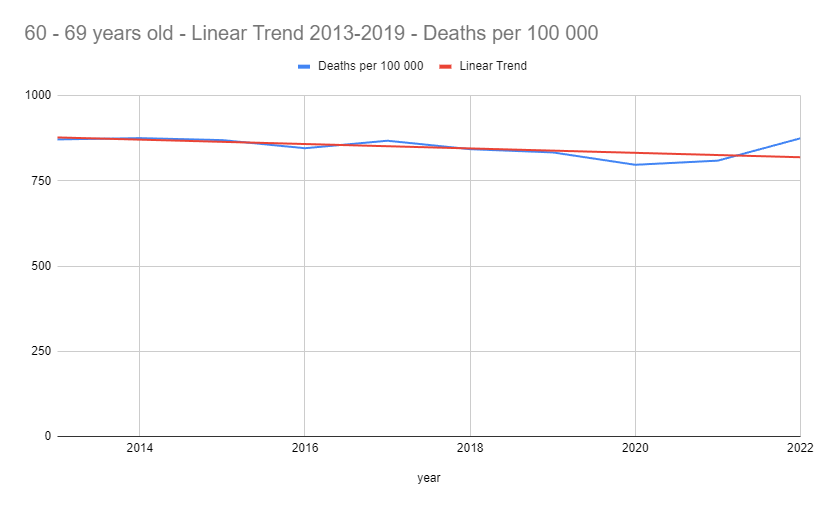
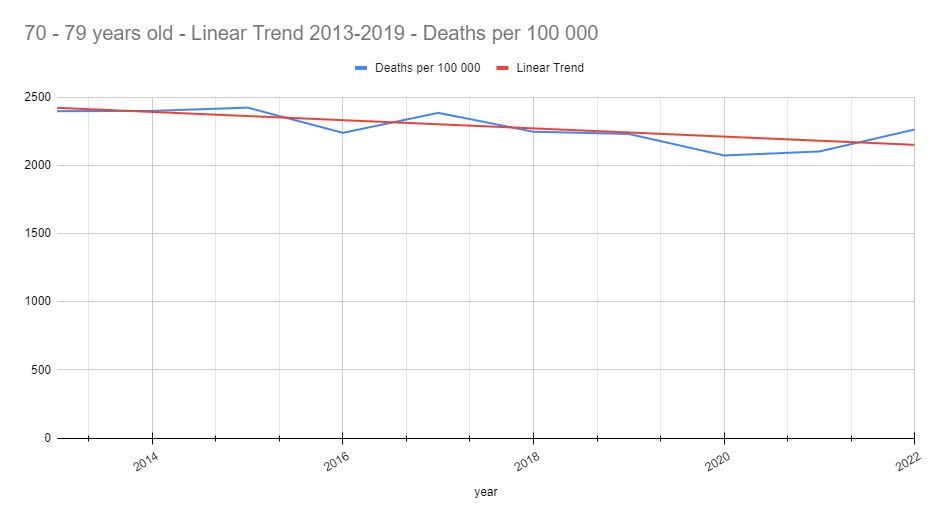
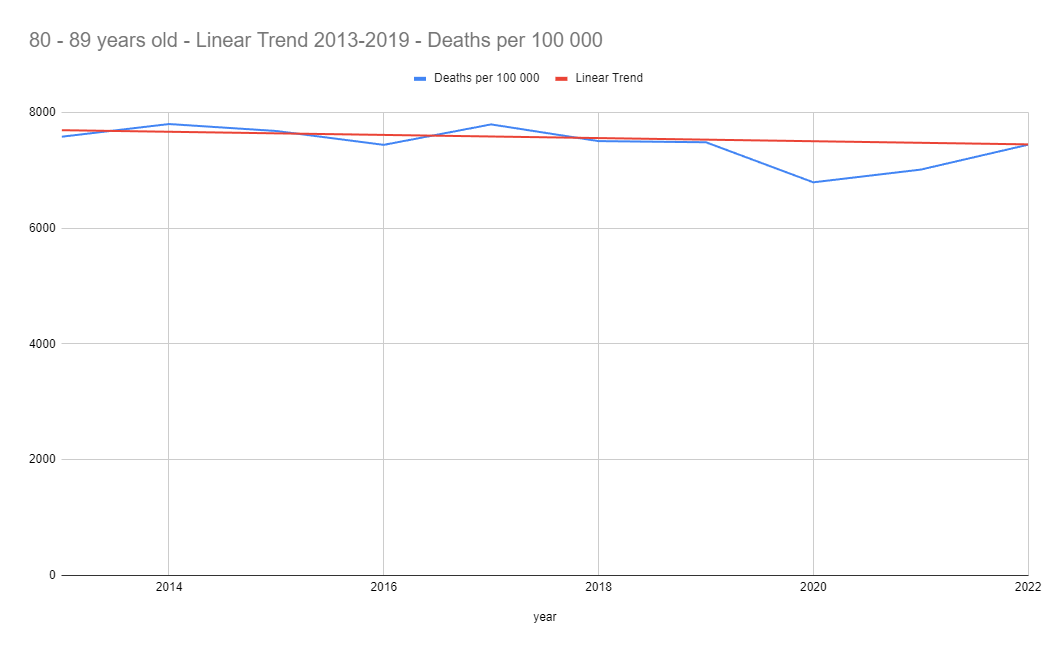
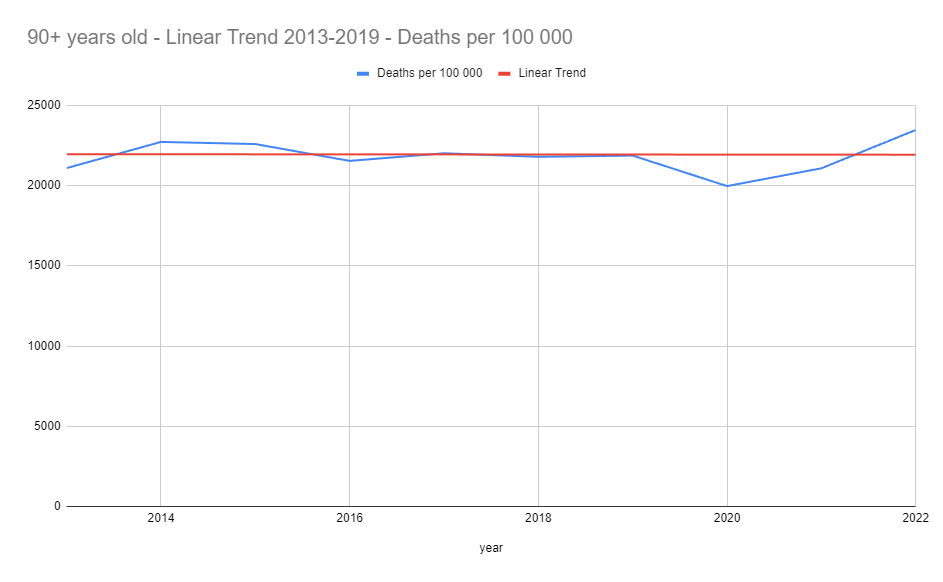
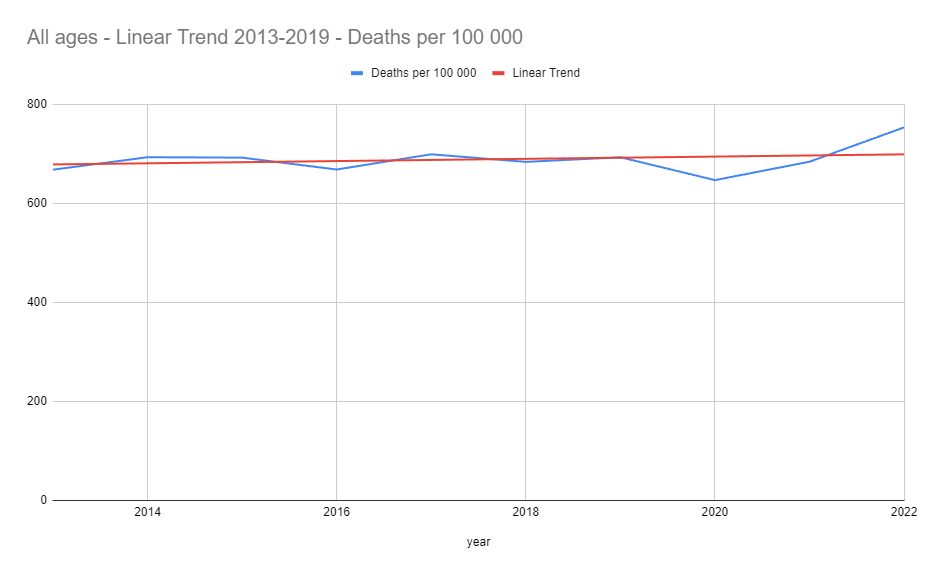
Mortality trends (orange) & effective rates (blue) are represented below. Z-score & percentages of deviations to linear trends are available in the detailed spreadsheets of each age group:
- Under 1 years old8
- 1 - 9 years old9
- 10 - 19 years old10
- 20 - 29 years old11
- 30 - 39 years old12
- 40 - 49 years old13
- 50 - 59 years old14
- 60 - 69 years old15
- 70 - 79 years old16
- 80 - 89 years old17
- 90+ years old18
- All ages19
Under 1 years old
1 - 9 years old
10 - 19 years old
20 - 29 years old
30 - 39 years old
40 - 49 years old
50 - 59 years old
60 - 69 years old
70 - 79 years old
80 - 89 years old
90+ years old
All ages
Conclusion
The only alert signal we can observe is the rise in infant mortality in 2021, consistent with observations in Scotland & France20.
The official figures for 2023, which are currently unpublished, have not been presented by Barry Young and are, therefore, not relevant to this analysis.
As a result of Kirsch’s new efforts to poison the well, Prof. Norman Fenton - quoted, obviously, way beyond what he had committed to - has shared his strong reserves21 and the batch analysis which would be interesting to make and confirm on trust-worthy data. Along with the time to deaths measurements, currently rendered pointless to analyse.
Mongol’s detailed breakdown on the topic is worth reading22.
Igor Chudov, rightfully skeptical of the data23 in which he noted significant discrepancies with the figures announced, then considered the possibility that Barry Young may be of good faith24. Although it seems unlikely to us, there remains a non negligible possibility that Barry Young is sincere. Ultimately, it is Kirsch's actions that have rendered the data unusable and unverifiable.
Kevin Mc Kernan saw his “Mega” drive and 820 Gb of professional data suspended for hosting the data released by Kirsch25 - under legal injunction. Furthermore, Kirsch is now undermining Andrew Bridgen's efforts in the United Kingdom26.
Until the introduced FOIs27 yield truly trustworthy data, or that at least the original, unaltered dataset is released, we advise extreme caution when re-using or drawing conclusions from the Kirsch dataset, as goes for any information shared by Kirsch, who already demonstrated his blatant disregard for accuracy28 on too many occasions to list them.
Meanwhile, the father of all limited hang-outs, Alex Jones, is on the affair already. Barry Young reiterates here his desire to have statisticians looking at the data. Is he even aware that it has been “obfuscated” by Steve ..?

The Perl code used to generate the figures presented is available on GitHub.
💬 Join the conversation
Want to like, comment, or share this article?
Head over to our Substack page to engage with the community.
Likes, comments, and shares are synchronized here every 5 minutes.
💬 Join the conversation
Want to like, comment, or share this article?
Head over to our Substack page to engage with the community.
Likes, comments, and shares are synchronized here every 5 minutes.